Using Docker Images During Development
Local development uses Docker Compose profiles under docker/profiles/. The debug
profile mounts locally built artifacts into containers tagged debug, so you avoid rebuilding images on every change.
We highly recommend ./gradlew quickstartDebug (or scripts/dev/datahub-dev.sh for agent workflows).
./gradlew quickstartDebug
This task is defined in docker/build.gradle and executes the following steps:
Builds all required artifacts to run DataHub. This includes both application code such as the GMS war, the frontend distribution zip which contains javascript, as well as secondary support docker containers.
Locally builds Docker images with the expected
debugtag required by the docker compose files.Starts the
debugprofile compose stack to mount local files directly in the containers with remote debugging ports enabled.
Once the debug docker images are constructed you'll see images similar to the following:
acryldata/datahub-frontend-react                 debug              e52fef698025   28 minutes ago   763MB
acryldata/datahub-gms                            debug              ea2b0a8ea115   56 minutes ago   408MB
acryldata/datahub-upgrade                       debug              322377a7a21d   56 minutes ago   463MB
At this point it is possible to view the DataHub UI at http://localhost:9002 as you normally would with quickstart.
Like quickstartDebug, there are a few other tasks that bring up a different set of containers, for example
quickstartDebugConsumers will also bring up mce-consumer and mae-consumer.
Reloading
Next, perform the desired modifications
To see these changes in the deployment, a rebuilt of modified artifacts and a restart of the container(s) is required to run with the updated code. The restart can be performed using following gradle task.
./gradlew :docker:reload
This single task will build the artifacts that were modified and restart only those containers that were affected by the rebuilt artifacts.
reload is generally much faster than re-running quickstartDebug and is recommended after an initial bringup of all services via quickstartDebug followed
by loading the incremental changes using reload.
If there are significant changes to the code, for example due to pulling the latest code, it is recommended to start with a quickstartDebug and then iterate using reload
Setting environment variables via env files
You can define different sets of environment variables for all the containers in an env file. The env files must be located in the docker/profiles folder.
To use the env file, run
DATAHUB_LOCAL_COMMON_ENV=my-settings.env ./gradlew quickstartDebug
The reload process continues to work, but the restarted containers will use the same settings that were present at the time of running ./gradlew quickstartDebug.
If you need to reload the containers with a different env file or changes made to the env file, a task reloadEnv builds the artifacts that have code changes
and recreates all the containers that refer to these the env file via the DATAHUB_LOCAL_COMMON_ENV environment variable.
The reload and reloadEnv tasks can only be run after running one of the debug variants of a quickstart task like quickstartDebug
Start/Stop
The following commands can pause the debugging environment to release resources when not needed.
Pause containers and free resources.
docker compose --project-directory docker/profiles -p datahub stop
Resume containers for further debugging.
docker compose --project-directory docker/profiles -p datahub start
Cleanup
To completely remove containers and volumes for a specific project, you can use the nuke tasks:
# Remove containers and volumes for specific projects
./gradlew quickstartNuke          # For default project (datahub)
./gradlew quickstartDebugNuke     # For debug project (datahub)
./gradlew quickstartCypressNuke   # For cypress project (dh-cypress)
Note: These are Gradle nuke tasks. For CLI-based cleanup, see
datahub docker nukein the quickstart guide.
Debugging
The default debugging process uses your local code and enables debugging by default for both GMS and the frontend. Attach to the instance using your IDE by using its Remote Java Debugging features.
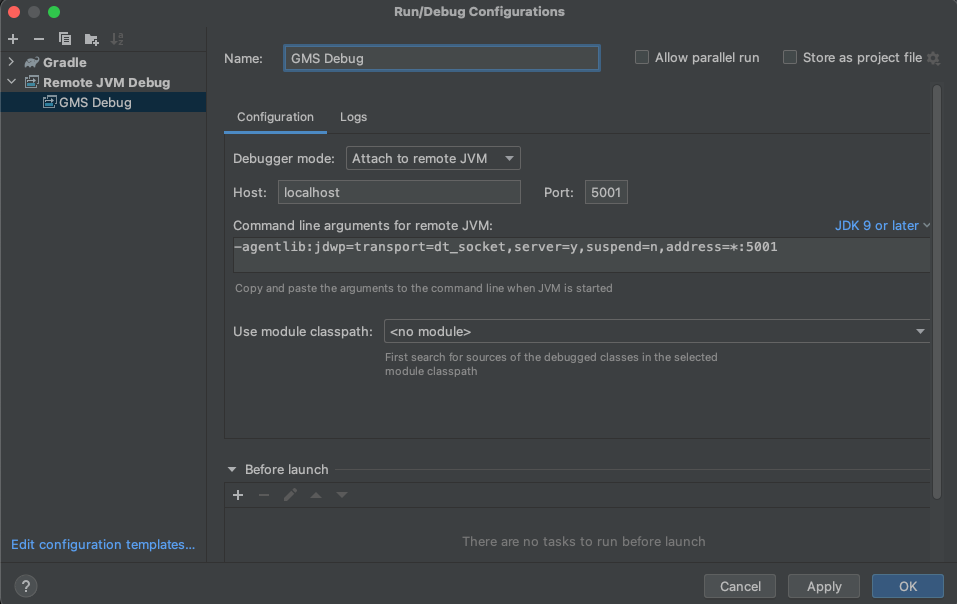
Environment variables control the debugging ports for GMS and the frontend.
DATAHUB_MAPPED_GMS_DEBUG_PORT- Default: 5001DATAHUB_MAPPED_FRONTEND_DEBUG_PORT- Default: 5002
IntelliJ Remote Debug Configuration
The screenshot shows an example configuration for IntelliJ using the default GMS debugging port of 5001.
Tips for People New To Docker
Accessing Logs
It is highly recommended you use Docker Desktop's dashboard to access service logs. If you double click an image it will pull up the logs for you.
Quickstart Conflicts
If you run quickstart, use ./gradlew quickstartDebug to return to using the debugging containers.
Docker Prune
If you run into disk space issues and prune the images & containers you will need to execute the ./gradlew quickstartDebug
again.
System Update
The datahub-upgrade job will not block the startup of the other containers as it normally
does in a quickstart or production environment. Normally this is process is required when making updates which
require Elasticsearch reindexing. If reindexing is required, the UI will render but may temporarily return errors
until this job finishes.
Running a specific service
docker compose up launches all services in the profile, including dependencies, unless they are already running.
To start only GMS (and its dependencies) under the debug profile:
docker compose --project-directory docker/profiles --profile debug -p datahub up datahub-gms
To start only GMS without dependencies:
docker compose --project-directory docker/profiles --profile debug -p datahub up --no-deps datahub-gms
See docker/profiles/README.md in the repository for available profiles.